Contents:
Main (Abstract)
Introduction
Methods
Results Part I: Verification that Albedo Increases Resulted from New Reflective Roofs
Results Part II: Identification of Building Characteristics Producing Large Albedo Increases
Discussion
References
Results Part I: Verification that Albedo Increases Resulted from New Reflective Roofs
Initially, the method of this study was applied to the original city-wide albedo and temperature change images that Mackey et al. had analyzed in order to verify that the method of this study could successfully replicate the previous findings. Figures 1 and 2 display the scatter plot used to derive the correlation between the two variables and the binned graph used to derive the slope of the regression respectively. The successfully replicated correlation of -0.306 and regression slope of -21.1 from Mackey et al.’s previous findings justify the process as suitable for comparison.

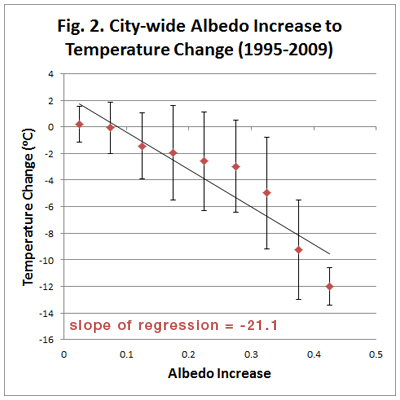
Figures 3 and 4 display the results of the same process applied to albedo and temperature changes of only the pixels within building footprints. When these building pixels are isolated, there is a slight increase in the strength of the correlation from -0.306 to -0.392 and an increase in the steepness of the regression curve from -21.1 to -27.116. This slight increase suggests that the changes in the building footprints are an important driver of the correlation to temperature decrease and are more important than the non-building albedo increases.


The results displayed in Figures 1-4 correspond to the 2 temperature change and 2 albedo change images on the main map.
In order to better determine how important the pixels in building footprints are to the observed correlations, the percentage of the total number of pixels increasing in albedo that lie in building footprints is determined. Over the whole city, this percentage is only 67.4% and does not present that convincing of an argument that reflective roofs are driving the albedo changes. However if this percentage is broken down by interval of albedo increase as it is in Figure 5, we find a surprising result. The percentage of increasing albedo pixels that lie in building footprints rises with the quantity of albedo increase until, at albedo increases of 0.35 to 0.45, 100% of pixels lie within building footprints. It is also important to note from Fugure 5 that, for all albedo increases above 0.2, more than 90% of all pixels lie within building footprints. When Figure 5 is viewed in relation to Figures 2 and, 4 it becomes apparent that the increases of albedo in building footprints are driving the significant drops in temperature.
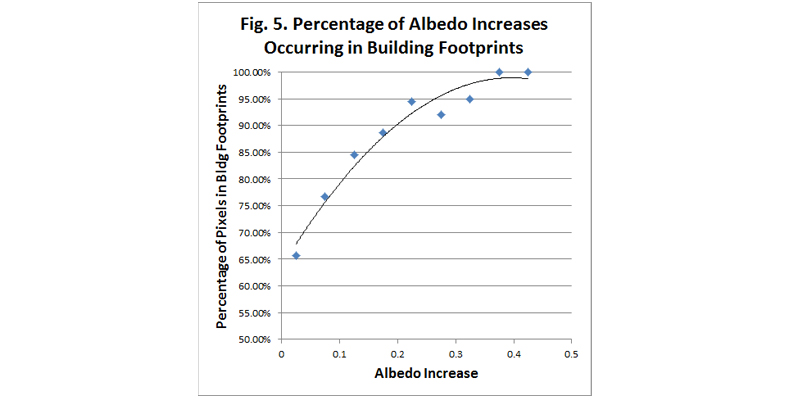
More information on the data used to derive Figure 5 can be found in Table 1, which shows the specific number of pixels in each albedo interval as well as the percentage of pixels lying in building footprints.

Continue to the Next Section: Results Part II: Identification of Building Characterisitcs Producing Large Albedo Increases